Growth
Managed Roster — Reporting Across Multiple Creators
The Starting Point
Several creator accounts being promoted separately, with no single view of how the group was performing.
The Challenge
Without one reporting view it was difficult to compare accounts or to see which periods were strongest across the roster.
The Strategy
- Bring the accounts into one management view
- Report on fixed date ranges rather than all-time figures
- Compare accounts on the same metrics
- Use the consolidated read to decide where promotional effort goes next
The Work
Accounts were managed from a single management view and earnings were reported on fixed ranges for the group.
The Change
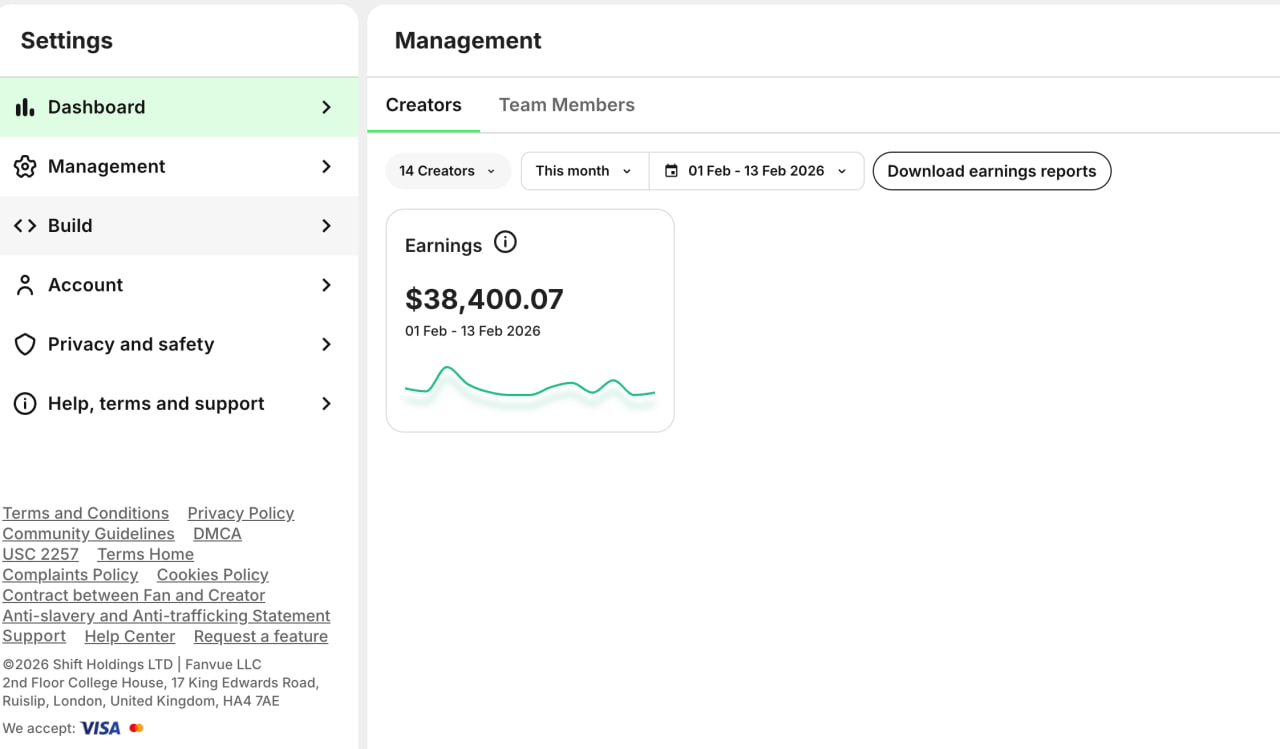
The management view shows 14 creators under one account with a reported figure for the selected range.
The Result
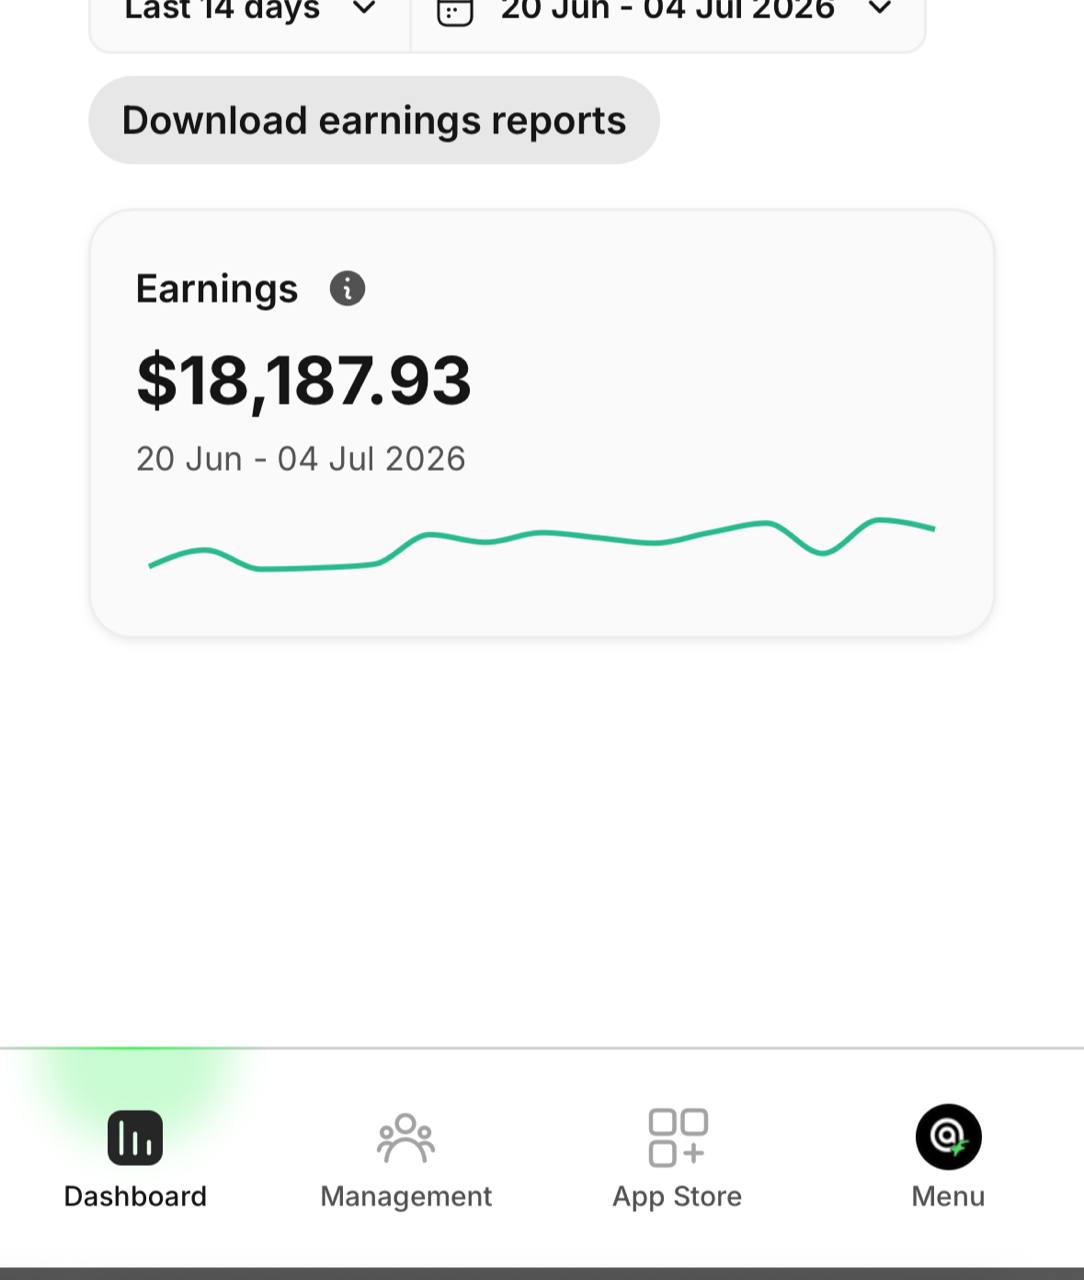
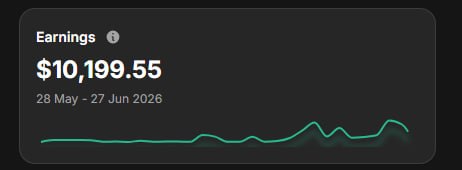
For 01 Feb – 13 Feb 2026 the management view reports $38,400.07 earnings across the creators selected. Separate dashboard views show $18,187.93 for 20 Jun – 04 Jul 2026 and $10,199.55 for 28 May – 27 Jun 2026.
Verified Performance
$38,400.07
Earnings, 01 – 13 Feb 2026
Source: Management view
14
Creators in the management view
Source: Management view
$18,187.93
Earnings, 20 Jun – 04 Jul 2026
Source: Dashboard
Only metrics visible in the evidence above are displayed. Figures not shown by the platform for this campaign are not claimed.
Ready To Discuss Your Account?
Every account is different. Let's look at your current position and discuss what could be improved.
Results Disclaimer
Previous results displayed on this website are examples from individual campaigns and are not a guarantee of future performance. Results can vary depending on account history, content quality, audience, consistency, promotional channels, market conditions and other factors. All statistics, screenshots and testimonials displayed represent genuine client experiences or campaign evidence.